


How to Use TradingView Like a Pro: A Strategic Guide for 2025
TradingView isn’t just a place to draw lines. It’s where serious investors design systems, test strategies, and see the market as it truly is — in motion, in structure, and in context.
In today’s markets, the difference between success and failure rarely comes from luck. It comes from clarity. While most retail traders are drowning in noise — chasing headlines, influencers, or the next meme coin — the ones who thrive are those who know how to read the market’s real language: price structure, momentum, volume, and time.
This is where TradingView steps in. Not as a cosmetic charting platform. Not as an app to check prices during your lunch break. But as a full-spectrum strategic environment — one that gives you the visibility, customization, and responsiveness needed to navigate modern financial markets.
You may think you already know how to use TradingView — and perhaps you’ve drawn a few trendlines, added RSI to your chart, or saved a layout. But that’s not mastery. Mastery is when TradingView becomes an extension of how you think: a mirror of your system, your logic, and your discipline.
This guide isn’t here to show you where the button for Bollinger Bands is. It’s here to help you reframe your entire relationship with market data. Whether you’re a long-term investor using DCA or a short-term trader reacting to global macro shifts, what you’re about to learn will shift how you see TradingView — and how you trade — permanently.
Let’s begin with the deeper shift happening across the investing world right now: the quiet but powerful return of technical thinking.
Why Technical Thinking Is Making a Comeback — and Why TradingView Is at the Center of It
Narratives change. Emotions fade. But structure remains.
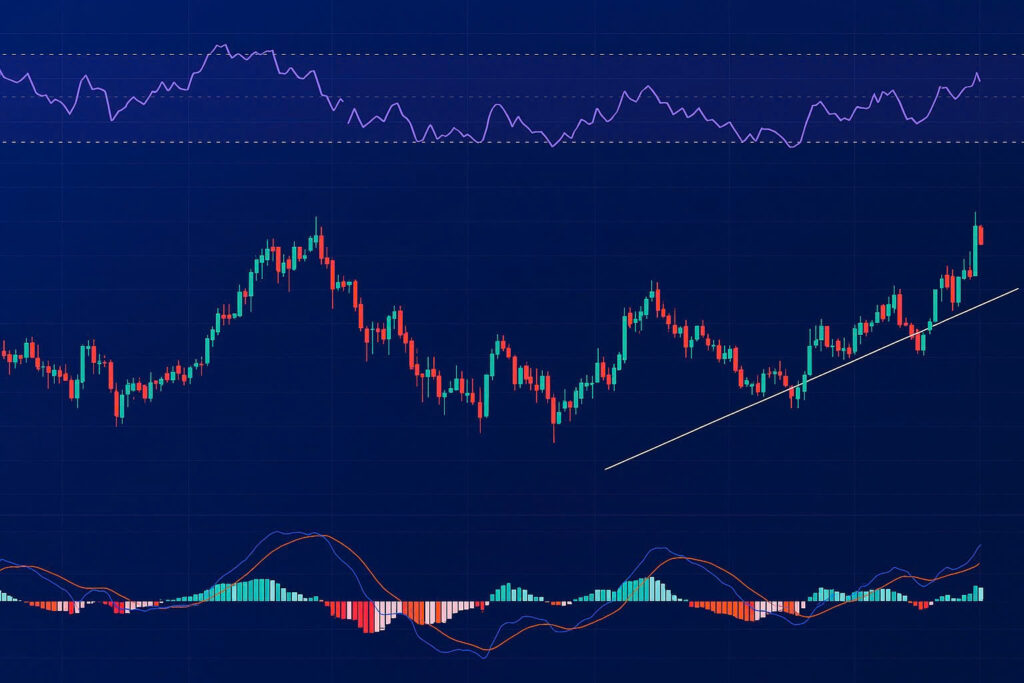
Over the past decade, retail investing has been heavily shaped by narratives — from meme stocks and influencer pump groups to social sentiment dashboards and crypto Twitter “signals.” But when the noise fades and the market corrects, only one question matters: where is price actually going?
That question — and how you answer it — marks the return of something powerful: technical thinking.
More and more investors are realizing that logic, not hype, wins over time. They’re moving away from blind speculation and toward systematic observation. They’re learning to trade what’s real: price, volume, time, and structure.
But here’s the truth: technical thinking isn’t just about reading charts. It’s about seeing the underlying behavior of the market — how participants are reacting to fear, opportunity, liquidity, and risk — and translating that behavior into clear decisions.
And this is where TradingView becomes irreplaceable.
It doesn’t just show you what the market has done. It shows you how the market thinks — through tools that allow you to map:
- Trend formation and reversal zones
- Volume-led breakouts and fakeouts
- Support/resistance flips that signal major turning points
- Consolidation ranges where institutional money positions quietly
More importantly, it shows you these things across multiple timeframes, in real time, with full customization, and with alerts that let you step away from the screen without losing your edge.
In a landscape where algorithms dominate and headlines mislead, TradingView allows individual traders to return to the one edge that machines still struggle to replicate: structured human interpretation.
If you’re serious about building a strategy, how you use TradingView will define how well you adapt to this new era of investing.
The era of blind trading is ending. The era of technical clarity has just begun.
TradingView Is Not Just a Chart — It’s a Strategic Ecosystem
If you treat TradingView like a visual tool, you’ll only get aesthetic clarity. But if you treat it like an ecosystem, you’ll unlock strategic clarity.
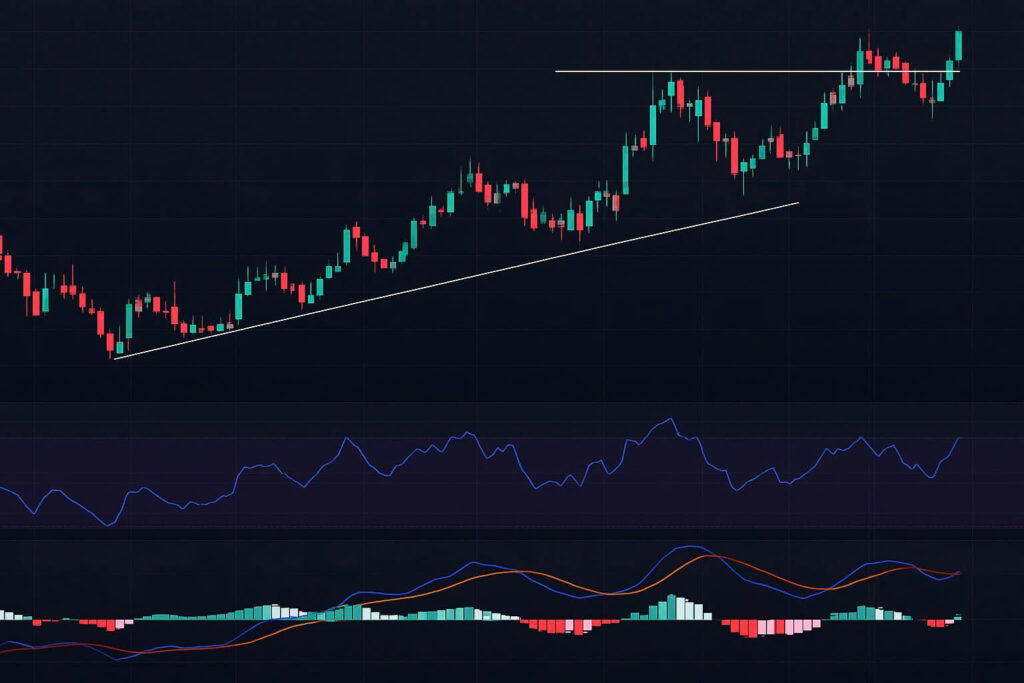
Many traders think they “know” TradingView. They’ve drawn a trendline. They’ve added RSI. Maybe they’ve even set a price alert once or twice. But that’s like saying you know how to fly a plane because you sat in the cockpit once.
The true power of TradingView doesn’t reveal itself until you realize it’s designed not just to show you the market — but to help you think, plan, and respond like a system.
Optimized for Multiframe Logic, Not Just Single Charts
TradingView’s interface isn’t flashy for the sake of it. It’s built for multi-timeframe decision-making.
A professional doesn’t ask: “What is the 1H chart doing?”
They ask: “How does this 1H signal fit into the daily structure?”
And: “Is this move part of a larger trend or a deviation?”
With TradingView, you can:
- Build synchronized layouts comparing 1D, 4H, and 15m in one screen
- Spot hidden divergence or volume imbalance across frames
- Tag key price zones that persist across time
This multi-frame context is what keeps traders from being shaken out by noise.
Map Market Structure the Way Institutions Do
TradingView lets you break free from “retail patterns” and start mapping the structure smart money reacts to.
You can draw:
- Accumulation zones (Wyckoff-style)
- Breaker blocks and liquidity traps
- Session ranges and weekly opens
- Fair value gaps, volume profile levels, and order blocks
Instead of looking for candlestick patterns, you begin to understand market architecture — a key shift that separates traders who guess from those who prepare.
This mindset shift is echoed in our article on intelligence-based strategy, where raw data was useless without structural interpretation. Trading is no different.
From Visual Tool to Tactical Engine
TradingView becomes even more powerful when you leverage its automation and customization features:
- Use watchlists to group assets by strategy (e.g., breakout coins, DCA portfolio, high volatility tokens)
- Set alerts based not only on price — but on indicator confluence or volume events
- Save different layouts for different styles: intraday setups vs. macro accumulation zones
- Build or import Pine Script indicators that highlight your own edge — not someone else’s
TradingView adapts to how you think. And as your strategy evolves, so does the system you build inside it.
Most platforms help you see price.
TradingView helps you see behavior. And in markets, behavior is everything.
From Watching Charts to Reading Market Behavior — The Skill You Can’t Afford to Skip
Every candle tells a story. But only trained eyes can read it.
The real edge in trading isn’t in seeing more charts — it’s in understanding the market’s intent.
You can teach someone to draw trendlines in 15 minutes. You can show them how to apply RSI or Bollinger Bands. But reading behavior — that’s different.
Market behavior is the dance between price, volume, time, and psychology. And TradingView, when used correctly, becomes the magnifying glass for that dance.
The Hidden Language of Market Structure
Most traders focus on individual candles or patterns. But what separates professionals is the ability to see the underlying structure:
- Is this a breakout or a trap?
- Is volume confirming the move — or contradicting it?
- Is this consolidation before expansion — or distribution before collapse?
TradingView makes this visible by letting you:
- Zoom between timeframes (M15 ↔ D1)
- Draw advanced structures (e.g., Wyckoff, BOS/CHOCH, liquidity sweep zones)
- Add volume profiles to see where interest is real
This is where charting becomes storytelling — and you become the narrator, not just the viewer.
Behavioral Candles and Context
One bullish engulfing candle doesn’t mean much — until you know:
- Where it appeared (support zone or middle of nowhere?)
- What preceded it (liquidity grab? consolidation?)
- What volume said at that exact moment
With TradingView’s deep customization, you can add volume overlays, indicator confluence, or even script your own behavioral cues.
Market behavior is about “why,” not just “what.”
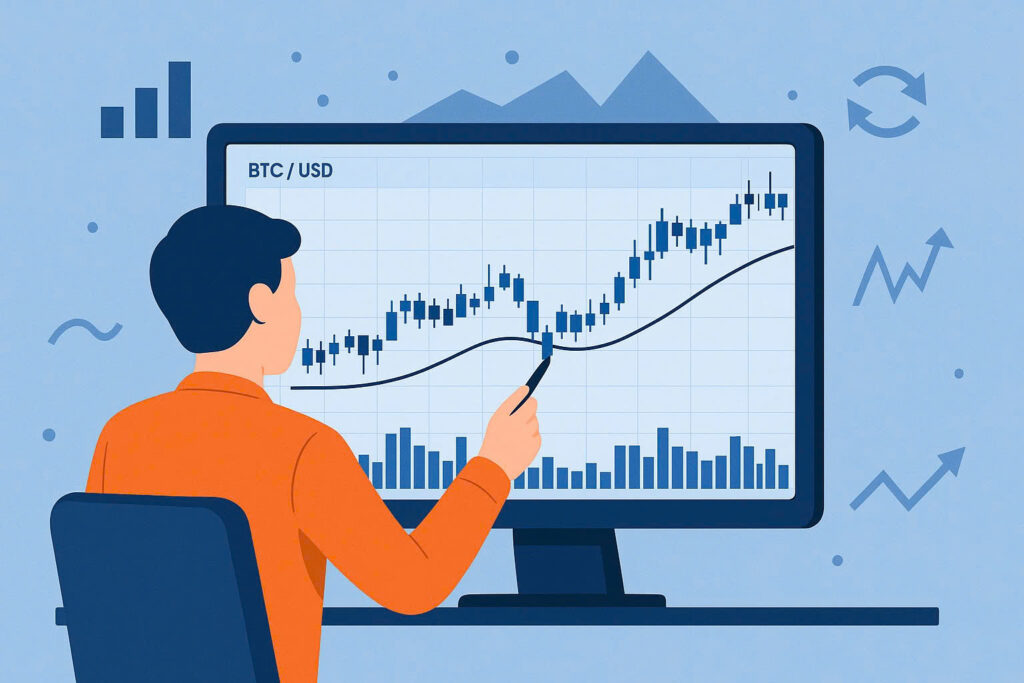
Example: BTC Retesting the MA200 on Daily Timeframe
Let’s take a real-world application:
- Bitcoin drops below its MA200 (D1)
- Panic selling kicks in
- But the next week, it climbs back and retests the MA200 — with low volume
What does this tell us?
A trained trader sees:
- Classic retest of a broken structure
- Bear trap liquidity reversal
- Opportunity to build a position early, before breakout confirmation
With TradingView, you can:
- Backtest this pattern
- Set alerts for future MA200 retests
- Save it as part of your “behavioral playbook”
Why This Skill Is Becoming Non-Negotiable
In an era where AI bots, algos, and institutions dominate, your edge as a retail trader isn’t speed. It’s interpretation.
You can’t compete on latency. But you can win on clarity.
Platforms like TradingView give you all the raw data — but only skillful behavior reading turns that data into decisions.
Trading is no longer just technical. It’s behavioral. And TradingView is your lab to study the psychology in motion.
How to Use TradingView as Your Strategic Command Center
In fast-moving markets, clarity is not just about what you see — it’s about how fast you can act on it. That’s where TradingView becomes more than a chart.
At a certain point in your trading journey, the question changes.
It’s no longer “Where should I draw this line?”
It becomes: “How can I systemize this setup, monitor multiple assets, get notified at the right moment — and execute without hesitation?”
That’s when TradingView stops being a tool… and becomes your command center.
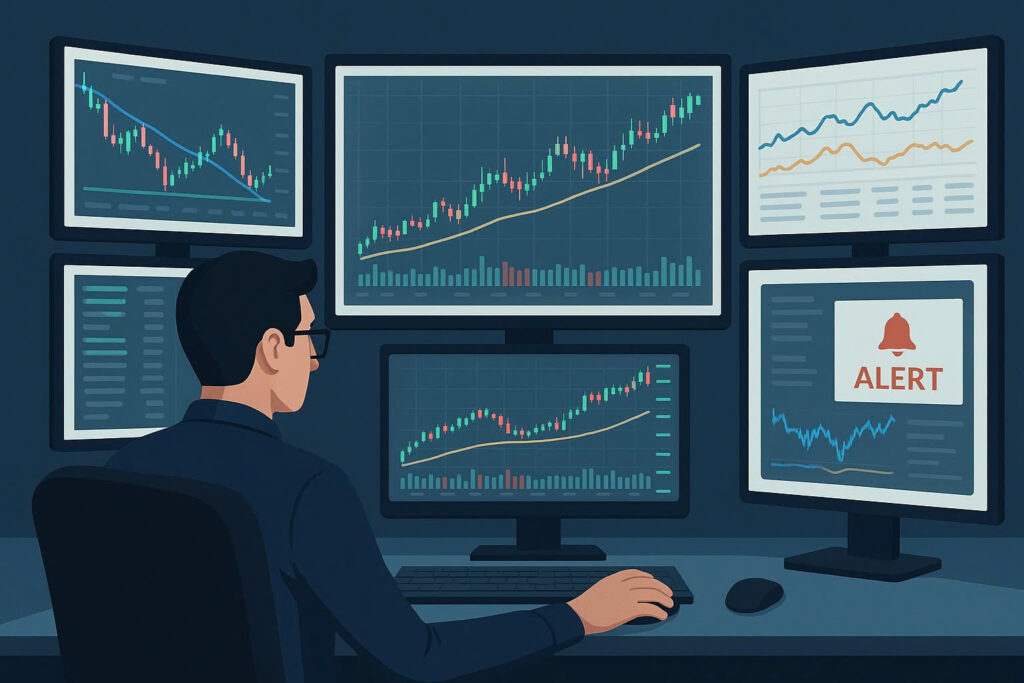
1. Alerts That Think for You (Even When You’re Offline)
Markets move without warning. Good trades rarely come with flashing signs — they require presence. But we can’t monitor charts 24/7. This is where TradingView’s alert system becomes a trader’s second brain.
Set alerts not just on price, but:
- When RSI crosses a certain level
- When volume spikes at key zones
- When your custom script confirms a setup
- When a trendline or Fibonacci level is broken
Alerts are triggered in real time and can reach you via pop-ups, email, or mobile app — allowing you to step away from your desk without stepping away from the market.
2. Multi-Asset Workspaces — One Screen, Total Vision
The average trader tracks 3–10 assets at a time. Professionals? More than 20.
TradingView lets you build multi-chart layouts with synchronized timeframes — perfect for:
- Monitoring BTC, ETH, and DXY simultaneously
- Watching stock indices while managing crypto entries
- Comparing sector rotations or altcoin strength relative to BTC
This isn’t just aesthetic. It gives you the context you need to make intelligent decisions — in one glance, across all markets.
3. Segment, Filter, and Focus with Watchlists
Too many traders waste time flipping through hundreds of charts. Smart traders organize their edge.
With TradingView’s watchlists, you can:
- Group assets by setup type: breakout, accumulation, news-based
- Track DCA positions separately from short-term plays
- Filter by volume, volatility, RSI, or custom screeners
You don’t chase setups — you manage a curated radar.
This same logic applies in our article on AI-powered market prediction: success doesn’t come from having more data — it comes from filtering for what matters.
4. Execute Directly from the Chart
You’ve spotted the trade. Everything lines up. The last thing you want is friction.
TradingView integrates directly with exchanges like:
This means you can trade instantly, from the same screen where you did your analysis — minimizing delay, maximizing precision.
5. Pine Script: Your Trading Intelligence, Automated
If you’re ready to turn repeatable setups into scripts, Pine Script is where TradingView becomes your R&D lab.
You can:
- Automate alerts based on your exact conditions
- Backtest ideas using historical data
- Build adaptive indicators that reflect how you see the market
No coding background? No problem — there’s a massive library of public scripts to build from and customize.
Tools that only show the market are common.
Tools that help you interpret, prepare, and act — that’s rare. That’s TradingView.
Free, Pro, or Premium? Matching the Right TradingView Plan to Your Strategy
The best trading system is the one you actually use. The same goes for your tools. More features don’t mean more profits — alignment does.
One of the most common misconceptions among new traders is that upgrading to a higher TradingView plan will somehow “unlock success.” But TradingView isn’t a cheat code — it’s a mirror that reflects how clearly you think.
So the real question is: Which plan matches the way you trade?
Here’s a breakdown — not by feature, but by strategic fit.
The Free Plan – Simple, But Surprisingly Capable
If you’re just starting out, or if your strategy revolves around long-term investing, trend-following, or DCA, the Free plan may be all you need.
You get:
- 1 chart per layout
- 3 indicators per chart
- 1 active alert
- Watchlists, basic tools, Pine Script access
- Full use of public indicators
Ideal for:
- New investors learning the basics
- Long-term DCA strategies (e.g., buying BTC every month)
- Manual technical reviews once a week
This is the same setup we recommend for readers following strategies like in How to Start Investing with $100 — simple, consistent, no clutter.
The Pro Plan – Built for Strategic Swing Traders
If you’re watching markets daily, managing multiple trades, or relying on alerts for timing — the Pro plan is your base of operations.
You get:
- 2 charts per layout
- 5 indicators per chart
- 10 active alerts
- Custom intervals (e.g., 2h, 8h)
- Ad-free experience
Ideal for:
- Swing traders using moving average or RSI-based systems
- Traders managing both crypto and stocks
- Investors who rely on alerts to monitor entries/exits
This is the plan where “chart-watching” turns into “system-building.”
The Pro+ and Premium Plans – Designed for Full-Time Analysts
Once you’re managing large portfolios, building your own Pine Scripts, or doing professional-grade research, higher tiers become strategic multipliers.
Pro+ includes:
- 4 charts per layout
- 10 indicators per chart
- 30 alerts
- Renko/Kagi/Range charts
- Multi-device login
Premium includes:
- 8 charts per layout
- 25 indicators per chart
- 400 alerts
- Second-based charts
- Unlimited saved layouts
- Priority support
Ideal for:
- Traders building algorithmic strategies
- Institutional-style technical analysis
- Advanced research workflows
But here’s the honest truth:
If you’re not pushing the limits of the Free or Pro plan, you don’t need Premium.
TradingView is not about paying more — it’s about removing the friction between your system and your execution. Choose the plan that lets you operate without delay, distraction, or constraint.
TradingView is Not a Shortcut – It’s a Multiplier for Real Strategy
Every trader starts by asking:
“What tool do I need to win?”
But that’s the wrong question.
The right question is:
“What system do I believe in — and how do I sharpen it?”
TradingView isn’t a cheat code.
It won’t compensate for emotional trades, inconsistent rules, or lack of risk control.
But if you already have discipline — even just the intent to build it — then TradingView becomes a force multiplier.
- It sharpens your timing.
- It reinforces your logic.
- It automates your alerts, filters your distractions, and speeds up your learning.
In 2025, markets will move faster, manipulate harder, and punish the unprepared.
Headlines will lie. Memes will fade. Hype will collapse.
What remains is what always has: price, structure, and logic.
And when those things matter most — TradingView becomes your edge.
But only if you’re not looking for shortcuts.
Only if you’re building a real strategy.
Because in this market, the one who survives…
isn’t the smartest.
Isn’t the richest.
It’s the one who executes with clarity — chart by chart, plan by plan.
And that clarity starts here.